Pie Chart Generator
Paste your data, choose a color scheme and mode, toggle the legend and slice labels — then export a clean SVG. Everything runs in your browser.
Edit data
| Label | Value |
|---|
Paste from a spreadsheet
Paste rows copied from Sheets/Excel, or one label value per line.
What is the Pie Chart Generator?
The gui.farm Pie Chart Generator is a free, browser-based tool for turning a small set of numbers into a clean pie chart — each wedge sized to its share of the whole. Paste your labels and values, pick a color scheme and a light or dark mode, and export a crisp SVG.
There's no account, no API key and no billing. The chart is drawn as a self-contained SVG in your browser, so it stays sharp at any size and drops straight into a .gui interface file.
Browse all free tools →How to make a pie chart
- Paste your data. One label value pair per line, like
Chrome 63. Each slice is a share of the total. - Style it. Choose a categorical palette or monochrome tints of one color, and a light or dark mode.
- Tune it. Add a small gap between slices, choose what shows on each slice, and toggle the legend.
- Export SVG. Download the chart or copy its SVG markup to paste anywhere.
Frequently asked
- Is the Pie Chart Generator really free?
- Yes. It's free to use with no account, no API key and no watermark.
- What format does it export?
- A clean, self-contained SVG — sharp at any size and easy to drop into slides, docs, websites or .gui interface files.
- How are the slice colors chosen?
- Pick Palette for a set of distinct hues, or Mono for tints of a single base color. Each slice is a share of the total.
- How do I enter my data?
- Type one "label value" pair per line, e.g. "Chrome 63". The chart redraws live as you edit.
Good for
- Dashboard and analytics UI mockups
- Shares of a whole — market, budget, traffic sources
- Slides, reports and case studies
- Website and app interface designs
- .gui interface files for humans and AI agents
Generate a pie chart from a single URL
Describe the chart with readable params — data, scheme, legend, surface — and the endpoint returns an SVG from that intent. No key, no SDK, no client library: it is one GET. The browser editor and agent-authored URLs share the same renderer, so what you see below is exactly what ships.
GET https://gui.farm/tools/charts/pie-chart.svg?data=Chrome:63,Safari:20,Edge:5,Other:12Data is label:value pairs (label optional — data=63,20,5 works, with an optional labels= list). Each slice is a share of the total; only positive values are drawn. Colors come from a categorical scheme, monochrome tints of a base color, or an explicit colors list. Open the same URL without .svg to edit the chart in the browser.
Live examples
Each preview is rendered by the endpoint from the URL beneath it.
-
Browser share
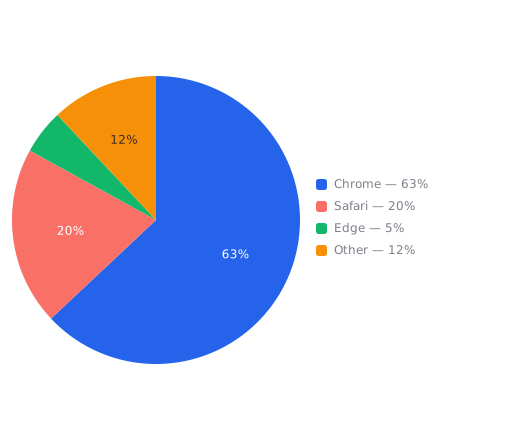
https://gui.farm/tools/charts/pie-chart.svg?data=Chrome:63,Safari:20,Edge:5,Other:12 -
Monochrome violet, on a dark surface

https://gui.farm/tools/charts/pie-chart.svg?data=A:40,B:25,C:20,D:15&scheme=mono&color=violet&surface=dark -
Names on slices, small gap

https://gui.farm/tools/charts/pie-chart.svg?data=Design:30,Eng:45,Sales:25&slicelabels=name&gap=2 -
No legend, no slice labels

https://gui.farm/tools/charts/pie-chart.svg?data=8,5,3,2&legend=hide&slicelabels=none
Drop it into a .gui file
Because the endpoint is a stable image URL, a .gui screen embeds a chart as a plain <img> — nothing to download or unzip. The chart stays live text an agent can read and edit.
<gui version="0.2" name="Browser share">
  <col w="360" p="20" gap="14" fill="#ffffff" radius="24">
    <text value="Browser share" font-size="19" font-weight="700" color="#111827" />
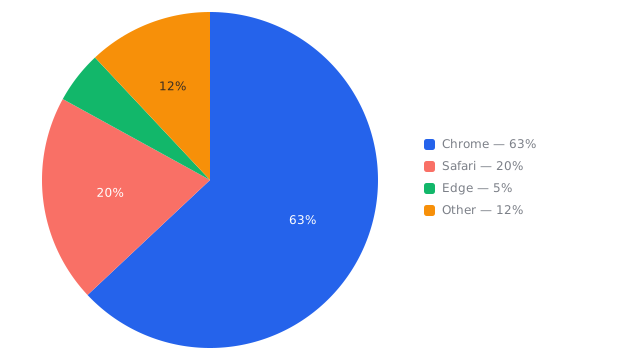
    <img src="https://gui.farm/tools/charts/pie-chart.svg?data=Chrome:63,Safari:20,Edge:5,Other:12&width=640&height=360" w="320" h="180" radius="16" />
    <text value="Chrome leads at 63%" font-size="14" color="#6b7280" />
  </col>
</gui>
Monthly revenue
Up 18% since January
.gui screenData
| Param | Accepts | Default | Notes |
|---|---|---|---|
data | Label:value pairs, comma-separated (label optional) | — | One slice per item, label:value. Values are magnitudes; only positive values are drawn and slices are shares of the total. |
labels | comma-separated text | — | Optional slice names for value-only data. |
Appearance
| Param | Accepts | Default | Notes |
|---|---|---|---|
scheme | palette, mono | palette | Slice colors: a categorical palette, or monochrome tints of the base color. |
color | a color name (blue, coral, …) or hex | blue | Base color for the mono scheme. `slice` is an alias. |
colors | comma-separated colors | — | Explicit per-slice colors, overriding the scheme. Cycles if shorter than the data. |
surface | light, dark | light | Tone the chart will sit on — sets label and legend contrast only. The background is never painted; the SVG is transparent. |
Elements
| Param | Accepts | Default | Notes |
|---|---|---|---|
slicelabels | percent, name, value, none | percent | Text drawn on each slice big enough to fit. |
legend | show, hide | show | A legend column listing each slice’s swatch, label and share. |
gap | degrees (0–20) | 0 | Separation between slices. |
start | degrees | -90 | Start angle. -90 begins at the top. |
Size
| Param | Accepts | Default | Notes |
|---|---|---|---|
width | pixels (50–2000) | 720 | Output width, and the drawing box. |
height | pixels (50–2000) | 440 | Output height, and the drawing box. |