# Pie Chart Generator — image API
Generate a pie chart SVG from a single `GET` request. No API key, no SDK, no client library: describe the chart in the query string and the endpoint renders it. This is the machine-readable twin of https://gui.farm/tools/charts/pie-chart — the interactive editor is omitted on purpose; everything an agent needs is below.
## Endpoint
```
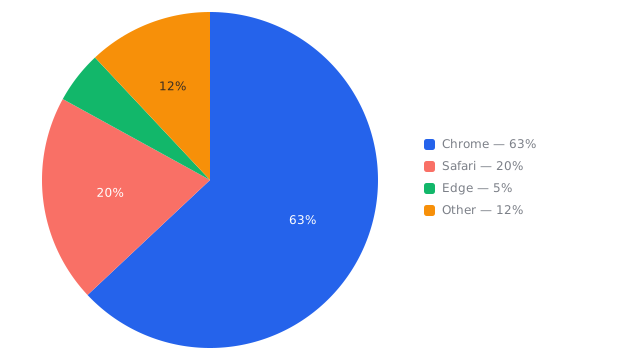
GET https://gui.farm/tools/charts/pie-chart.svg?data=Chrome:63,Safari:20,Edge:5,Other:12
```
Returns `image/svg+xml`. Data is `label:value` pairs, comma-separated (the label is optional, so `data=63,20,5` works too, with an optional `labels=` list). Each slice is a share of the total; only positive values are drawn. Colors accept a named color (see https://gui.farm/colors) or a hex value. The SVG is always transparent — `surface` only chooses label/legend contrast. Opening the same URL without `.svg` opens the interactive editor pre-loaded with that chart.
## Parameters
### Data
| Param | Accepts | Default | Notes |
| --- | --- | --- | --- |
| `data` | Label:value pairs, comma-separated (label optional) | — | One slice per item, label:value. Values are magnitudes; only positive values are drawn and slices are shares of the total. |
| `labels` | comma-separated text | — | Optional slice names for value-only data. |
### Appearance
| Param | Accepts | Default | Notes |
| --- | --- | --- | --- |
| `scheme` | palette, mono | palette | Slice colors: a categorical palette, or monochrome tints of the base color. |
| `color` | a color name (blue, coral, …) or hex | blue | Base color for the mono scheme. `slice` is an alias. |
| `colors` | comma-separated colors | — | Explicit per-slice colors, overriding the scheme. Cycles if shorter than the data. |
| `surface` | light, dark | light | Tone the chart will sit on — sets label and legend contrast only. The background is never painted; the SVG is transparent. |
### Elements
| Param | Accepts | Default | Notes |
| --- | --- | --- | --- |
| `slicelabels` | percent, name, value, none | percent | Text drawn on each slice big enough to fit. |
| `legend` | show, hide | show | A legend column listing each slice’s swatch, label and share. |
| `gap` | degrees (0–20) | 0 | Separation between slices. |
| `start` | degrees | -90 | Start angle. -90 begins at the top. |
### Size
| Param | Accepts | Default | Notes |
| --- | --- | --- | --- |
| `width` | pixels (50–2000) | 720 | Output width, and the drawing box. |
| `height` | pixels (50–2000) | 440 | Output height, and the drawing box. |
## Examples
- Browser share: https://gui.farm/tools/charts/pie-chart.svg?data=Chrome:63,Safari:20,Edge:5,Other:12
- Monochrome violet, on a dark surface: https://gui.farm/tools/charts/pie-chart.svg?data=A:40,B:25,C:20,D:15&scheme=mono&color=violet&surface=dark
- Names on slices, small gap: https://gui.farm/tools/charts/pie-chart.svg?data=Design:30,Eng:45,Sales:25&slicelabels=name&gap=2
- No legend, no slice labels: https://gui.farm/tools/charts/pie-chart.svg?data=8,5,3,2&legend=hide&slicelabels=none
## Use it inside a .gui file
Because the endpoint is a stable image URL, a `.gui` screen embeds a chart as a plain `![]() ` — nothing to download or unzip. The chart stays live text an agent can read and edit.
```xml
` — nothing to download or unzip. The chart stays live text an agent can read and edit.
```xml
 ```
---
```
---