Bar Chart Generator
Paste your data, pick one color and mode, switch between vertical and horizontal bars, round the corners and toggle values — then export a clean SVG. Everything runs in your browser.
Edit data
| Label | Value |
|---|
Paste from a spreadsheet
Paste rows copied from Sheets/Excel, or one label value per line.
What is the Bar Chart Generator?
The gui.farm Bar Chart Generator is a free, browser-based tool for turning a small set of numbers into a clean bar chart. Paste your labels and values, choose one color and a light or dark mode, pick vertical or horizontal bars, and export a crisp SVG — ready for slides, docs, dashboards, websites or app mockups.
There's no account, no API key and no billing. The chart is drawn as a self-contained SVG in your browser, so it stays sharp at any size and drops straight into a .gui interface file.
Browse all free tools →How to make a bar chart
- Paste your data. One label value pair per line, like
Jan 32. The chart redraws as you type. - Style it. Pick one color and a light or dark mode, and choose vertical or horizontal bars.
- Tune it. Toggle the grid and value labels, and round the bar corners to taste.
- Export SVG. Download the chart or copy its SVG markup to paste anywhere.
Frequently asked
- Is the Bar Chart Generator really free?
- Yes. It's free to use with no account, no API key and no watermark.
- What format does it export?
- A clean, self-contained SVG — sharp at any size and easy to drop into slides, docs, websites or .gui interface files.
- Can I make horizontal bars?
- Yes. Switch Direction to Horizontal — handy when category names are long.
- Can I show the values?
- Yes. Turn on Values to print each bar’s number at its end.
Good for
- Dashboard and analytics UI mockups
- Comparing categories — revenue, counts, scores
- Slides, reports and case studies
- Website and app interface designs
- .gui interface files for humans and AI agents
Generate a bar chart from a single URL
Describe the chart with readable params — data, bar, orient, surface — and the endpoint returns an SVG from that intent. No key, no SDK, no client library: it is one GET. The browser editor and agent-authored URLs share the same renderer, so what you see below is exactly what ships.
GET https://gui.farm/tools/charts/bar-chart.svg?data=Jan:32,Feb:41,Mar:38&bar=coralData is label:value pairs (label optional — data=10,20,30 works, with an optional labels= list). Colors accept a named color or a hex value. Negative values grow from a zero baseline. The SVG is always transparent — surface only picks label/grid contrast for wherever you place it; hide both label sets for an edge-to-edge fill. Open the same URL without .svg to edit the chart in the browser.
Live examples
Each preview is rendered by the endpoint from the URL beneath it.
-
Revenue by month, coral
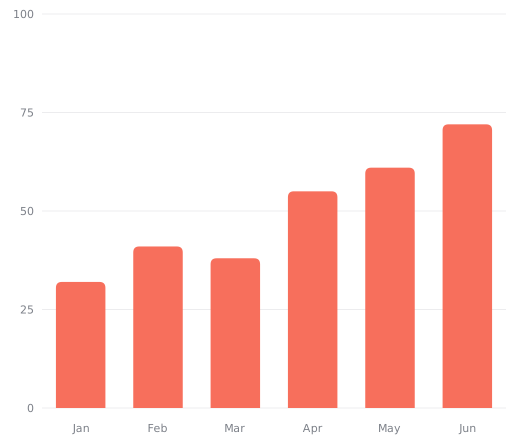
https://gui.farm/tools/charts/bar-chart.svg?data=Jan:32,Feb:41,Mar:38,Apr:55,May:61,Jun:72&bar=coral -
Horizontal, teal on a dark surface

https://gui.farm/tools/charts/bar-chart.svg?data=North:120,South:150,East:135,West:180&bar=teal&orient=horizontal&surface=dark -
Rounded, with values shown

https://gui.farm/tools/charts/bar-chart.svg?data=Q1:120,Q2:150,Q3:135,Q4:180&bar=violet&radius=12&values=show -
Minimal — no labels, no grid

https://gui.farm/tools/charts/bar-chart.svg?data=10,14,12,20,18,26,24,30&bar=blue&xlabels=hide&ylabels=hide&grid=hide
Drop it into a .gui file
Because the endpoint is a stable image URL, a .gui screen embeds a chart as a plain <img> — nothing to download or unzip. The chart stays live text an agent can read and edit.
<gui version="0.2" name="Monthly revenue">
  <col w="360" p="20" gap="14" fill="#ffffff" radius="24">
    <text value="Monthly revenue" font-size="19" font-weight="700" color="#111827" />
    <img src="https://gui.farm/tools/charts/bar-chart.svg?data=Jan:32,Feb:41,Mar:38,Apr:55,May:61,Jun:72&bar=teal&width=640&height=360" w="320" h="180" radius="16" />
    <text value="Up 18% since January" font-size="14" color="#6b7280" />
  </col>
</gui>
Monthly revenue

Up 18% since January
.gui screenData
| Param | Accepts | Default | Notes |
|---|---|---|---|
data | Label:value pairs, comma-separated (label optional) | — | The series to plot. Each item is label:value; value-only items are allowed. Negative values grow from a zero baseline. |
labels | comma-separated text | — | Optional category labels for value-only data. |
Appearance
| Param | Accepts | Default | Notes |
|---|---|---|---|
bar | a color name (blue, coral, …) or hex | blue | Bar fill color. `color` is an alias. |
surface | light, dark | light | Tone the chart will sit on — sets label and gridline contrast only. The background is never painted; the SVG is transparent. |
orient | vertical, horizontal | vertical | Bar direction. Horizontal reads well for long category names. |
radius | pixels (0–40) | 6 | Corner rounding on the value end of each bar. 0 is square. |
Elements
| Param | Accepts | Default | Notes |
|---|---|---|---|
grid | show, hide | show | Gridlines along the value axis. |
values | show, hide | hide | Draw each bar’s value at its end. |
xlabels | show, hide | show | X-axis (bottom) labels. Hiding both label sets makes the chart fully edge-to-edge. |
ylabels | show, hide | show | Y-axis (left) labels. |
Size
| Param | Accepts | Default | Notes |
|---|---|---|---|
width | pixels (50–2000) | 720 | Output width, and the drawing box — the bars reflow to it. |
height | pixels (50–2000) | 440 | Output height, and the drawing box. |